For example, we want to open an order on BNNC (Binance) and OKEX (OKex) Select them.
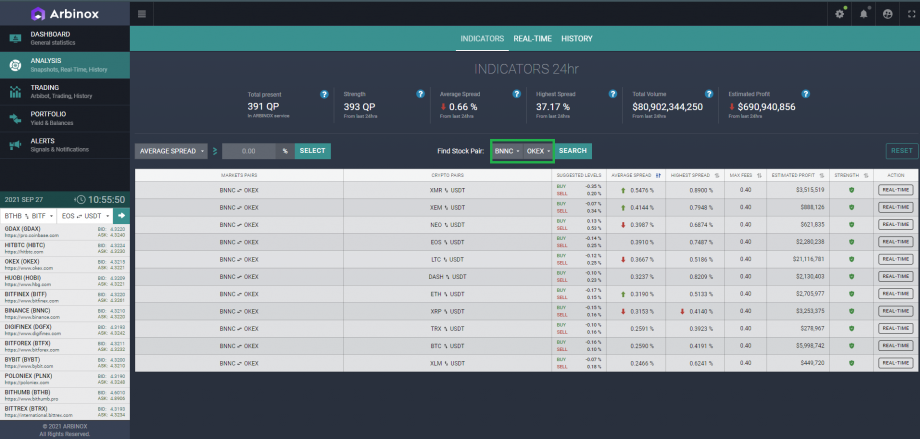
We chose QP and we need to conduct an analysis, we click Real Time.
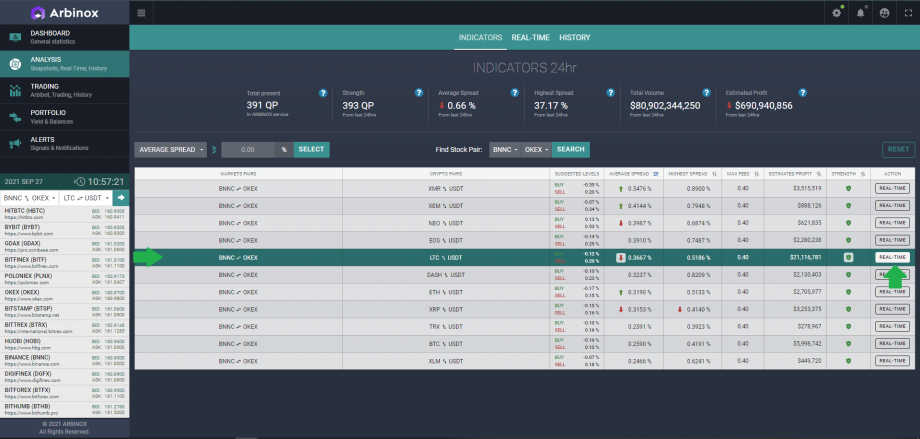
Real Time – This section allows us to see all the necessary data for analysis and decision making.
In the first step above, we see indicators with indicators for 24 hours.
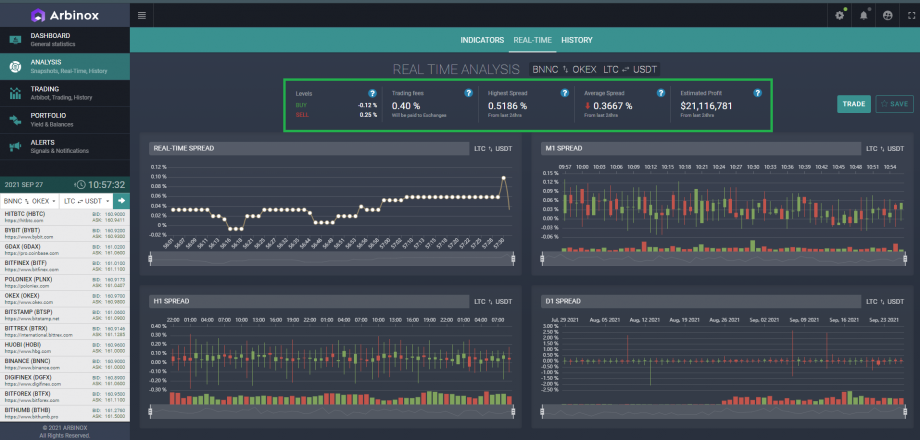
Real Time Spread this chart shows every second movement (tick) of the spread in real time.
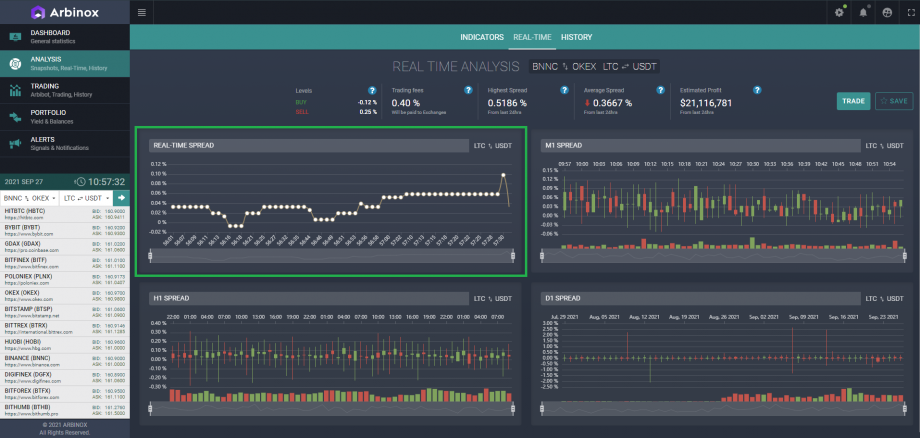
- M1 Spread: Minute chart of the spread movement
- H1 Spread: Hour chart of the spread movement
- D1 Spread: Day chart of the spread movement
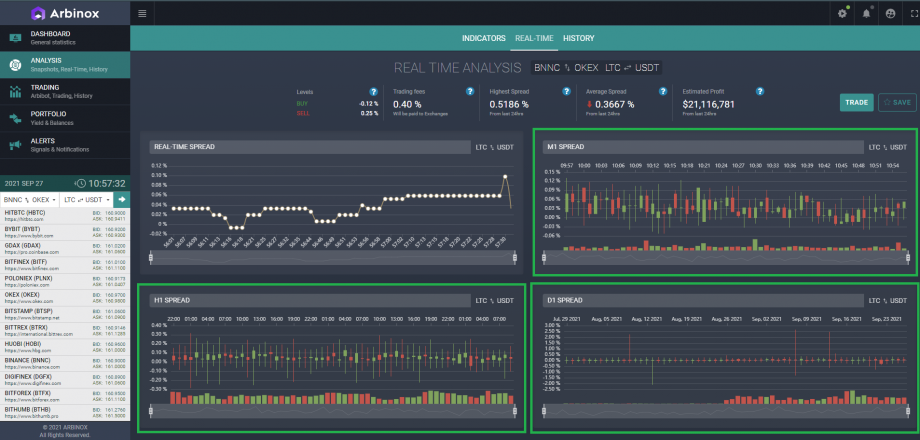
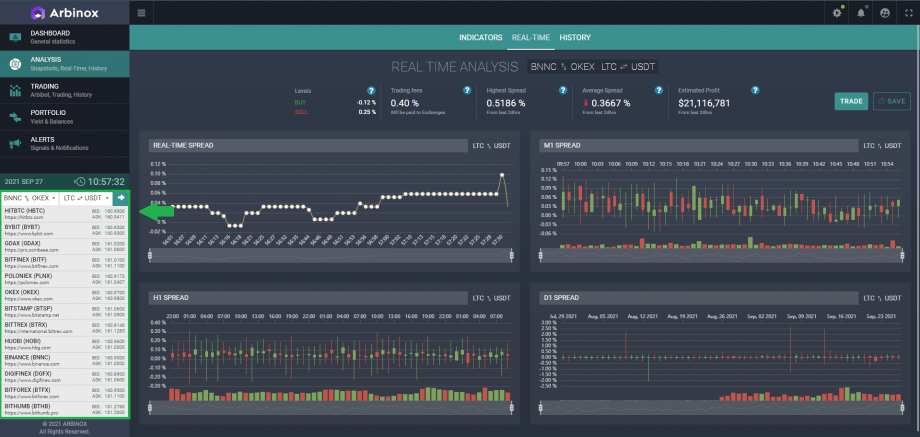
In this section, we can see the BID and ASK values for this QP across all exchanges in USDT represented on the Arbinox platform.
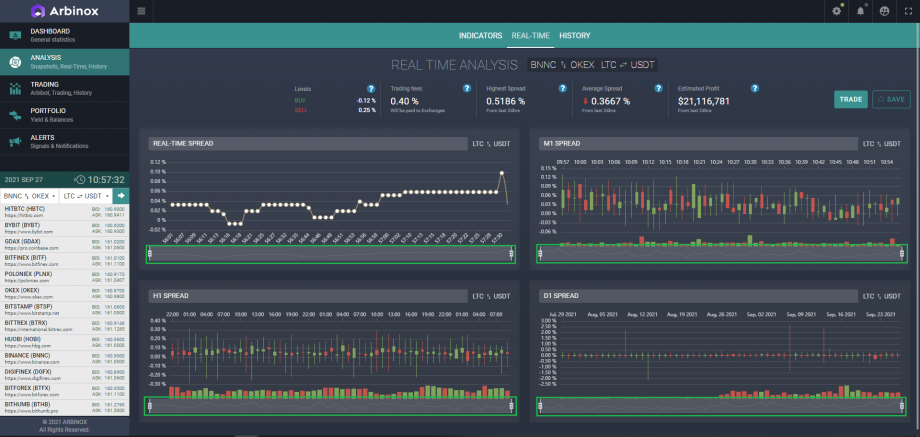
We can also decrease and increase each graph, it is necessary in the analysis process. To analyze a time frame period.
It is more convenient to carry out analysis in the History section
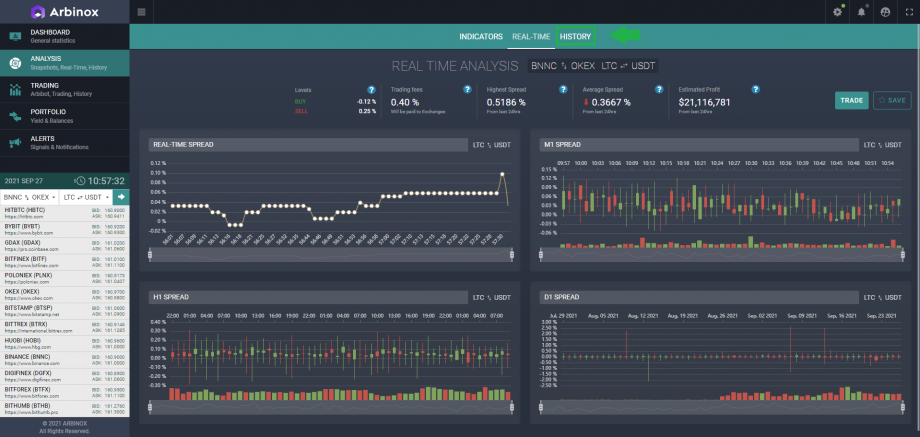
Here we see the same three time frames, but we can look at the history more broadly.
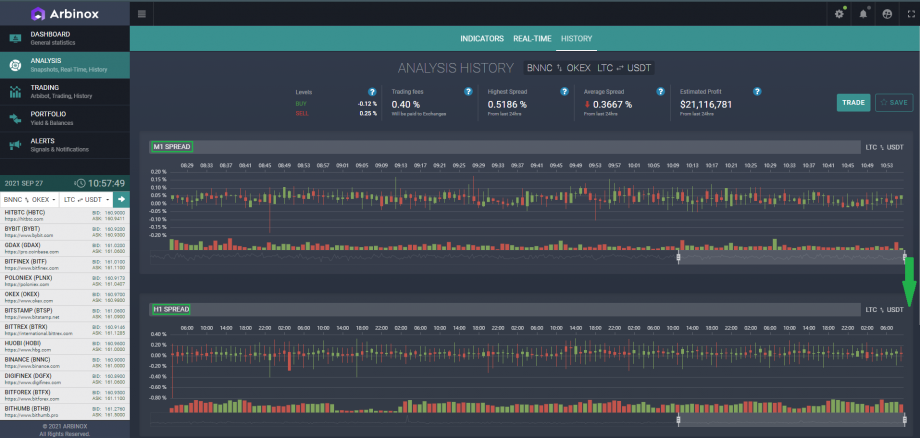
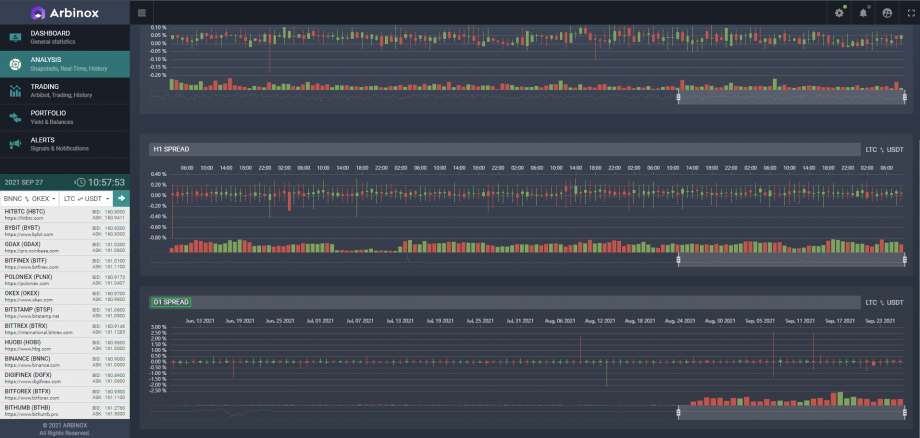
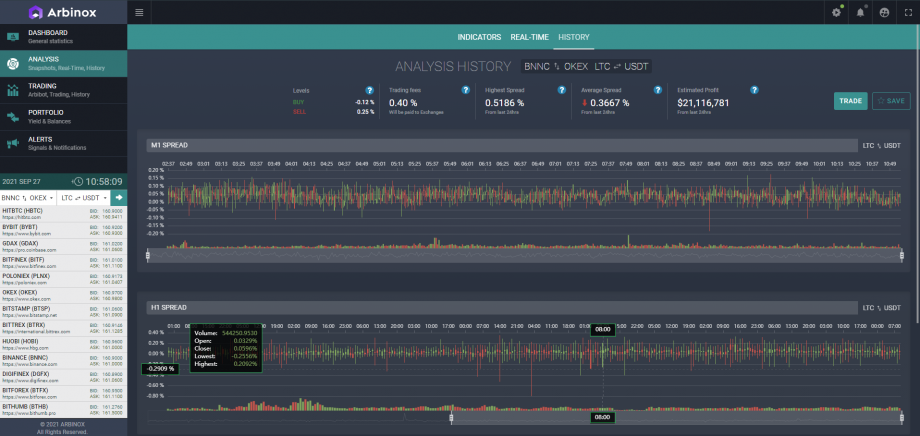
We can also view a summary of each candlestick on the chart.
If you want to save the QP, click Save.
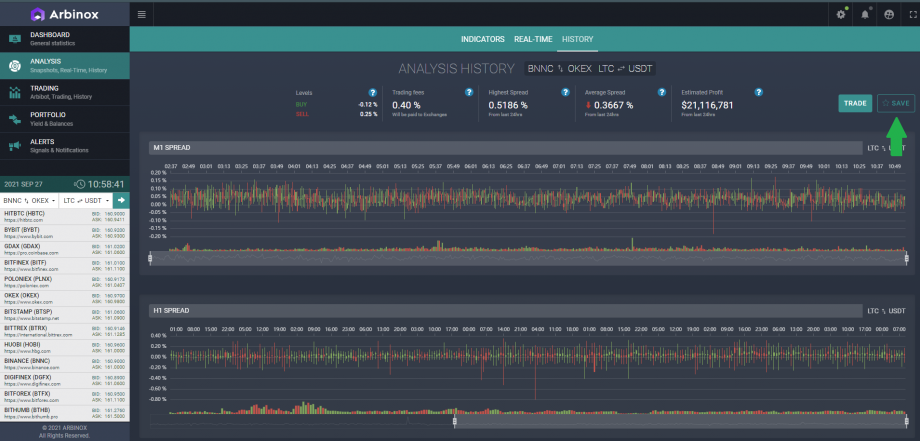
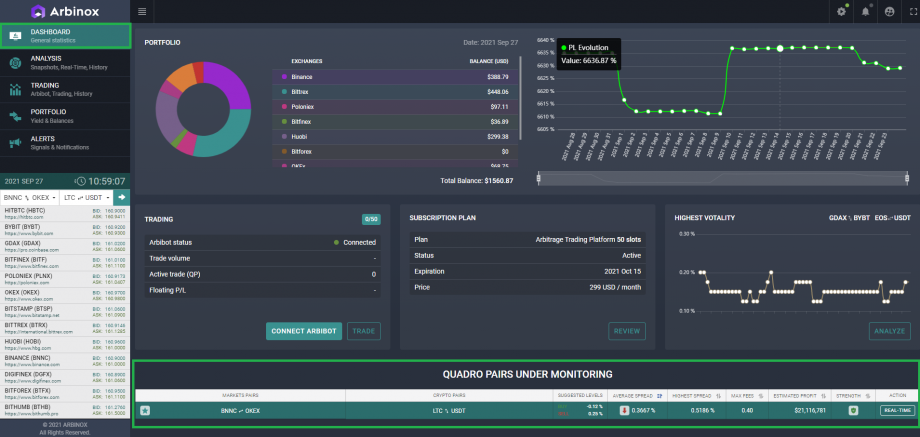
After that, if you go to the Dashboard and scroll to the bottom, you will find the QP Under Monitoring section.


Leave A Comment?
You must be logged in to post a comment.